はじめに
新規に構築したWindowsサーバで監視のテストを実施することになりました。
死活監視は対象サーバをシャットダウンすればすぐテストできますが、リソース監視(CPU使用率、メモリ使用率、ディスク使用率)はOSの標準機能だけではテストできないので負荷をかける専用ツールを使用します。
Microsoftが提供している負荷ツールをご紹介します。
CPUの負荷ツール
CPUに負荷をかけるには「cpustress」を使用します。
https://docs.microsoft.com/ja-jp/sysinternals/downloads/cpustres
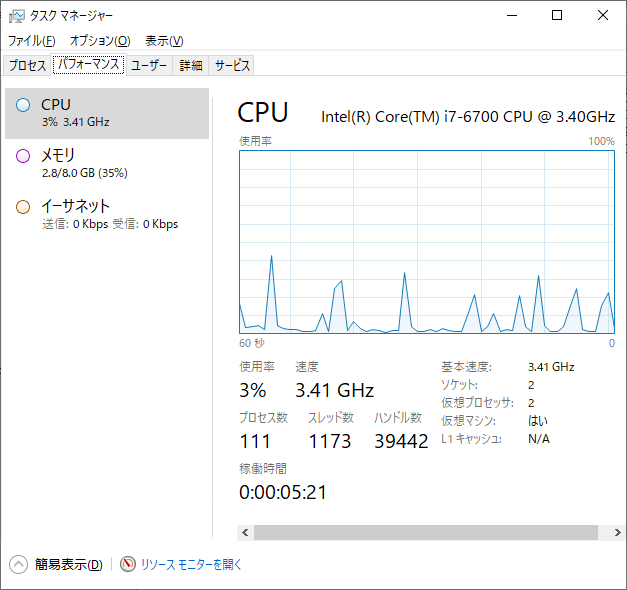
負荷をかける前のCPU使用率は数パーセントから10パーセントくらいです。
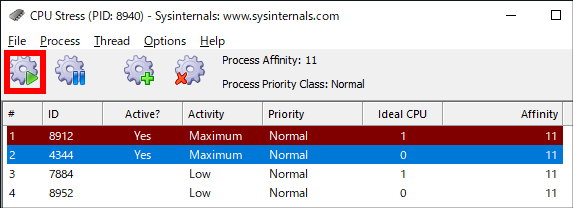
「cpustress」ツールを使用して負荷をかけます。
各行を選択して「Activity」や「priority」を任意に設定します。赤四角のアイコンをクリックします。
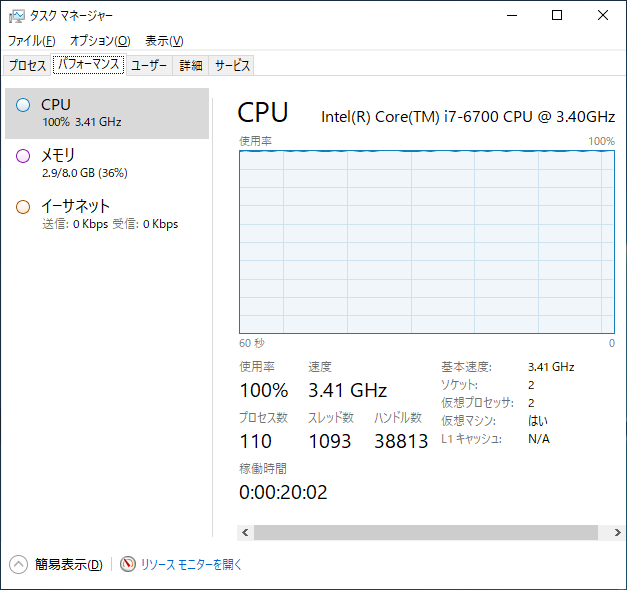
CPU使用率が100パーセントになりました。
メモリの負荷ツール
メモリに負荷をかけるには「Testlimit」を使用します。
https://docs.microsoft.com/ja-jp/sysinternals/downloads/testlimit
使用中のメモリは3.1GBあります。使用率は39パーセントです。
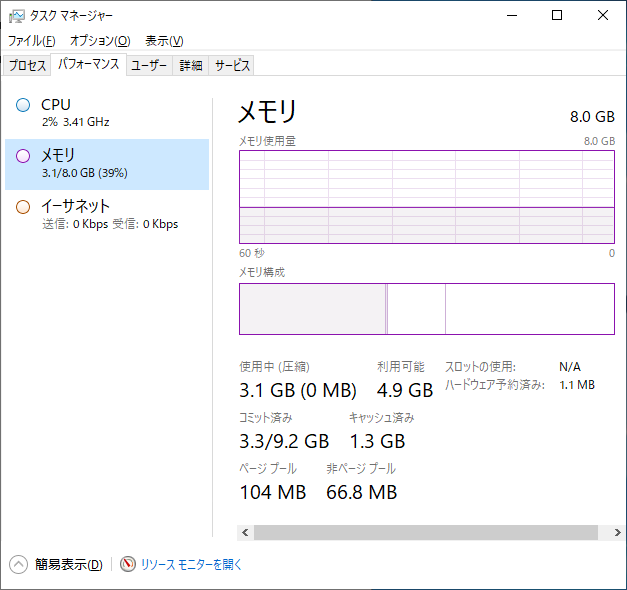
利用可能なメモリが4.9GBあるので、Testlimitで3.9GBのメモリを確保してみます。
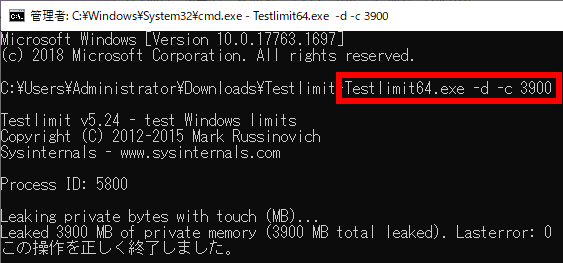
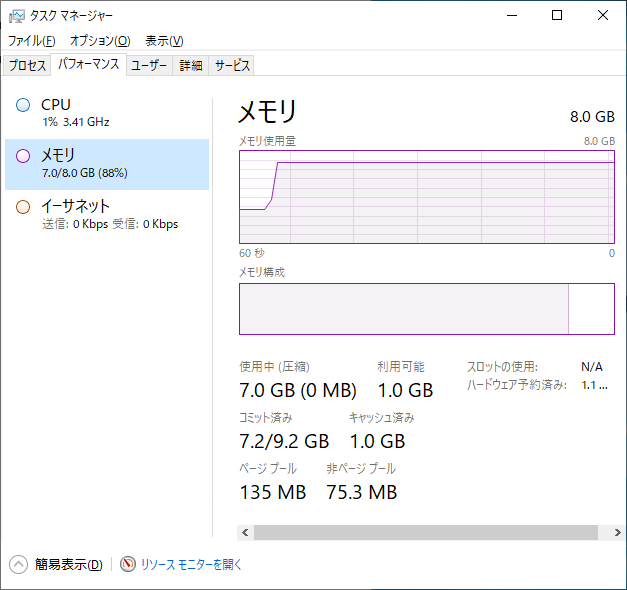
使用中のメモリが7GB、利用可能メモリが1GB、使用率が88パーセントになりました。
ディスクの負荷ツール
ディスクi/Oに負荷をかけるには「DiskSpd」を使用します。
https://github.com/Microsoft/diskspd
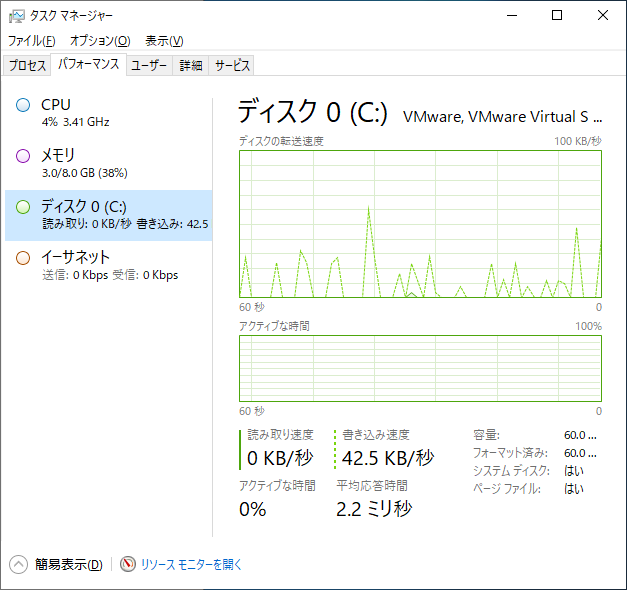
負荷をかける前のディスクI/Oの状態です。
カレントディレクトリに10GBのファイル「test.dat」を作成し、30秒間の読み込みを実行します。
C:\>diskspd.exe -c10G -d30 test.dat

Command Line: diskspd.exe -c10G -d30 test.dat

Input parameters:

        timespan:   1
        -------------
        duration: 30s
        warm up time: 5s
        cool down time: 0s
        random seed: 0
        path: 'test.dat'
                think time: 0ms
                burst size: 0
                using software cache
                using hardware write cache, writethrough off
                performing read test
                block size: 65536
                using sequential I/O (stride: 65536)
                number of outstanding I/O operations: 2
                thread stride size: 0
                threads per file: 1
                using I/O Completion Ports
                IO priority: normal

System information:

        computer name: Windows2019
        start time: 2021/09/19 08:33:20 UTC

Results for timespan 1:
*******************************************************************************

actual test time:       30.00s
thread count:           1
proc count:             2

CPU |  Usage |  User  |  Kernel |  Idle
-------------------------------------------
   0|  30.35%|   4.01%|   26.34%|  69.65%
   1|  27.80%|   3.44%|   24.36%|  72.20%
-------------------------------------------
avg.|  29.07%|   3.72%|   25.35%|  70.93%

Total IO
thread |       bytes     |     I/Os     |    MiB/s   |  I/O per s |  file
------------------------------------------------------------------------------
     0 |      7395409920 |       112845 |     235.06 |    3761.00 | test.dat (10240MiB)
------------------------------------------------------------------------------
total:        7395409920 |       112845 |     235.06 |    3761.00

Read IO
thread |       bytes     |     I/Os     |    MiB/s   |  I/O per s |  file
------------------------------------------------------------------------------
     0 |      7395409920 |       112845 |     235.06 |    3761.00 | test.dat (10240MiB)
------------------------------------------------------------------------------
total:        7395409920 |       112845 |     235.06 |    3761.00

Write IO
thread |       bytes     |     I/Os     |    MiB/s   |  I/O per s |  file
------------------------------------------------------------------------------
     0 |               0 |            0 |       0.00 |       0.00 | test.dat (10240MiB)
------------------------------------------------------------------------------
total:                 0 |            0 |       0.00 |       0.00

C:\>
読み取り速度が「275MB/秒」前後を確認できました。


コメント