
はじめに
CloudWatchでEC2インスタンスを監視する場合、CPU使用率は簡単に設定できますがメモリ使用率やディスク使用率は簡単に設定できません。これは標準メトリクスとカスタムメトリクスの違いです。
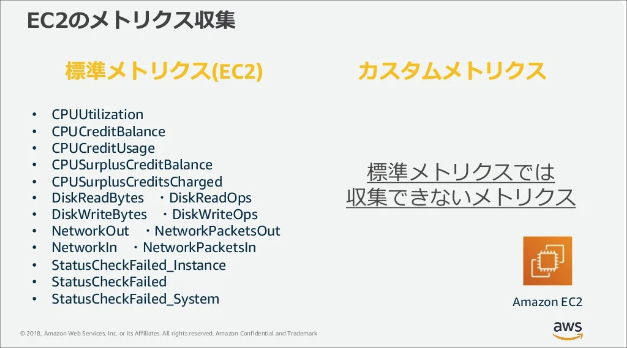
CPU使用率はハイパーバイザーからデータを取得できますが、メモリ使用率やディスク使用率はOSから情報を取得することになります。そのためOSから取得したデータをCloudWatch側に連携するためAgentのインストールと設定が必要になります。
作業の流れ
- SSMエージェントのインストール
- IAMロールの設定
- CloudWatchエージェントのインストール
- CloudWatchエージェントの設定ファイル作成
- Collectdのインストール
- EC2インスタンスのIAMロール変更
- CloudWatchエージェントの起動
- CloudWatchメトリクスの確認
手順
SSMエージェントのインストール
EC2インスタンスにSSMエージェントがインストールされているか確認します。
[ec2-user@ip-10-0-1-74 ~]$ sudo systemctl status amazon-ssm-agent
● amazon-ssm-agent.service - amazon-ssm-agent
   Loaded: loaded (/usr/lib/systemd/system/amazon-ssm-agent.service; enabled; vendor preset: enabled)
   Active: active (running) since Sun 2022-08-07 05:59:57 UTC; 49s ago
 Main PID: 3082 (amazon-ssm-agen)
   CGroup: /system.slice/amazon-ssm-agent.service
           tq3082 /usr/bin/amazon-ssm-agent
           mq3248 /usr/bin/ssm-agent-worker

Aug 07 05:59:57 ip-10-0-1-74.ap-northeast-1.compute.internal amazon-ssm-agent[3082]: 2022-08-07 05:59:57 INFO Agent will take identity from EC2
Aug 07 05:59:58 ip-10-0-1-74.ap-northeast-1.compute.internal amazon-ssm-agent[3082]: 2022-08-07 05:59:57 INFO [amazon-ssm-agent] using named pipe cha...r IPC
Aug 07 05:59:58 ip-10-0-1-74.ap-northeast-1.compute.internal amazon-ssm-agent[3082]: 2022-08-07 05:59:57 INFO [amazon-ssm-agent] using named pipe cha...r IPC
Aug 07 05:59:58 ip-10-0-1-74.ap-northeast-1.compute.internal amazon-ssm-agent[3082]: 2022-08-07 05:59:57 INFO [amazon-ssm-agent] using named pipe cha...r IPC
Aug 07 05:59:58 ip-10-0-1-74.ap-northeast-1.compute.internal amazon-ssm-agent[3082]: 2022-08-07 05:59:57 INFO [amazon-ssm-agent] amazon-ssm-agent - v...575.0
Aug 07 05:59:58 ip-10-0-1-74.ap-northeast-1.compute.internal amazon-ssm-agent[3082]: 2022-08-07 05:59:57 INFO [amazon-ssm-agent] OS: linux, Arch: amd64
Aug 07 05:59:58 ip-10-0-1-74.ap-northeast-1.compute.internal amazon-ssm-agent[3082]: 2022-08-07 05:59:57 INFO [CredentialRefresher] Identity does not...esher
Aug 07 05:59:58 ip-10-0-1-74.ap-northeast-1.compute.internal amazon-ssm-agent[3082]: 2022-08-07 05:59:58 INFO [amazon-ssm-agent] [LongRunningWorkerCo...ocess
Aug 07 05:59:58 ip-10-0-1-74.ap-northeast-1.compute.internal amazon-ssm-agent[3082]: 2022-08-07 05:59:58 INFO [amazon-ssm-agent] [LongRunningWorkerCo...arted
Aug 07 05:59:58 ip-10-0-1-74.ap-northeast-1.compute.internal amazon-ssm-agent[3082]: 2022-08-07 05:59:58 INFO [amazon-ssm-agent] [LongRunningWorkerCo...conds
Hint: Some lines were ellipsized, use -l to show in full.
[ec2-user@ip-10-0-1-74 ~]$
「Active: active (running)」よりSSMエージェントがインストールされていることが確認できました。もし、インストールされていない場合は公式サイトを参考にインストールします。
IAMロールの設定
2つのロールを作成します。
- EC2インスタンスからCloudWatchのメトリクスに書き込みを行うためのロール
- AWS Systems Manager のパラメータストアに書き込みを行うためのロール
CloudWatchAgentServerRoleの作成
IAMサービスにアクセスします。
左ペインから「ロール」をクリックします。「ロールを作成」ボタンをクリックします。
信頼されたエンティティ画面は以下の通り設定します。
信頼されたエンティティタイプ:「AWSのサービス」にチェックを入れる。
ユースケース:「EC2」にチェックを入れる。
「次へ」ボタンをクリックします。
許可ポリシー画面は2つ選択します。フィルタボックスを使って選択して下さい。
・CloudWatchAgentServerPolicy
・AmazonSSMManagedInstanceCore
「次へ」ボタンをクリックします。
ロールの詳細画面は以下の通り設定します。
ロール名:CloudWatchAgentServerRole
ポリシー名:「CloudWatchAgentServerPolicy」と「AmazonSSMManagedInstanceCore」の2つが表示されていること。
「ロールを作成」ボタンをクリックします。
CloudWatchAgentAdminRoleの作成
同様に2つ目のロールを作成します。
IAMサービスにアクセスします。
左ペインから「ロール」をクリックします。「ロールを作成」ボタンをクリックします。
信頼されたエンティティ画面は以下の通り設定します。
信頼されたエンティティタイプ:「AWSのサービス」にチェックを入れる。
ユースケース:「EC2」にチェックを入れる。
「次へ」ボタンをクリックします。
許可ポリシー画面は2つ選択します。フィルタボックスを使って選択して下さい。
・CloudWatchAgentAdminPolicy
・AmazonSSMManagedInstanceCore
「次へ」ボタンをクリックします。
ロールの詳細画面は以下の通り設定します。
ロール名:CloudWatchAgentAdminRole
ポリシー名:「CloudWatchAgentAdminPolicy」と「AmazonSSMManagedInstanceCore」の2つが表示されていること。
「ロールを作成」ボタンをクリックします。
ロールのアタッチ
AWS Systems Manager のパラメータストアにconfigを保存できるようロールを設定します。
EC2サービスにアクセスします。
左ペインから「インスタンス」をクリックします。対象のインスタンスにチェックを入れます。
アクションボタンから[セキュリティ]-[IAMロールを変更]をクリックします。
IAMロールは「CloudWatchAgentAdminRole」を選択します。
「IAMロールの更新」ボタンをクリックします。
CloudWatchエージェントのインストール
Systems Managerサービスにアクセスします。
左ペインから「Run Command」をクリックします。「Run Command」ボタンをクリックします。
コマンドの実行画面は以下の通り設定します。
コマンドドキュメント:「AWS-ConfigureAWSPackage」にチェックを入れる。
コマンドのパラメータ
Action:Install
Name:AmazonCloudWatchAgent
ターゲット
インスタンスを手動で選択するにチェックを入れる。
インスタンス:対象のインスタンスにチェックを入れる。
「実行」ボタンをクリックします。
ステータスが「成功」していたらインストール完了です。
CloudWatchエージェントの設定ファイル作成
ウィザードを使用してCloudWatchエージェント設定ファイルを作成します。対象サーバにログインしてコマンドを実行します。
[ec2-user@ip-10-0-1-74 ~]$ sudo /opt/aws/amazon-cloudwatch-agent/bin/amazon-cloudwatch-agent-config-wizardウィザードが起動するので質問に回答していきます。
回答は数字を入力します。ただ以下の場合はデフォルトで1が選択されているのでそのままEnterキーを押下しても問題ありません。
どのOSでエージェントを使用する予定ですか?
================================================================
= Welcome to the Amazon CloudWatch Agent Configuration Manager =
=                                                              =
= CloudWatch Agent allows you to collect metrics and logs from =
= your host and send them to CloudWatch. Additional CloudWatch =
= charges may apply.                                           =
================================================================
On which OS are you planning to use the agent?
1. linux
2. windows
3. darwin
default choice: [1]:
1
EC2かオンプレミスのどちらか?
Trying to fetch the default region based on ec2 metadata...
Are you using EC2 or On-Premises hosts?
1. EC2
2. On-Premises
default choice: [1]:
1
どのユーザーでエージェントを実行する予定ですか?
Which user are you planning to run the agent?
1. root
2. cwagent
3. others
default choice: [1]:
1
StatsDデーモンをオンにしますか?
Do you want to turn on StatsD daemon?
1. yes
2. no
default choice: [1]:
1StatsDデーモンがリッスンするポートは8125でいいですか?
Which port do you want StatsD daemon to listen to?
default choice: [8125]
8125
StatsDデーモンのcollect間隔はどれくらいですか?
What is the collect interval for StatsD daemon?
1. 10s
2. 30s
3. 60s
default choice: [1]:
1
StatsDデーモンが収集するメトリクスの集計間隔はどれくらいですか?
What is the aggregation interval for metrics collected by StatsD daemon?
1. Do not aggregate
2. 10s
3. 30s
4. 60s
default choice: [4]:
4
CollectDからメトリクスを監視しますか?警告:CollectDがインストールされていないと、Agentの起動に失敗します。
Do you want to monitor metrics from CollectD? WARNING: CollectD must be installed or the Agent will fail to start
1. yes
2. no
default choice: [1]:
1
CPUやメモリなどのメトリクスも監視しますか?
Do you want to monitor any host metrics? e.g. CPU, memory, etc.
1. yes
2. no
default choice: [1]:
1
コアごとのCPUメトリックスを監視したいですか?
Do you want to monitor cpu metrics per core?
1. yes
2. no
default choice: [1]:
2
ec2 のディメンション (ImageId, InstanceId, InstanceType, AutoScalingGroupName) が利用可能であれば、すべてのメトリクスに追加しますか?
Do you want to add ec2 dimensions (ImageId, InstanceId, InstanceType, AutoScalingGroupName) into all of your metrics if the info is available?
1. yes
2. no
default choice: [1]:
1
ec2のディメンション(InstanceId)を集計しますか?
Do you want to aggregate ec2 dimensions (InstanceId)?
1. yes
2. no
default choice: [1]:
1
メトリクスをどれくらいの間隔で収集しますか?
Would you like to collect your metrics at high resolution (sub-minute resolution)? This enables sub-minute resolution for all metrics, but you can customize for specific metrics in the output json file.
1. 1s
2. 10s
3. 30s
4. 60s
default choice: [4]:
4
どのようなデフォルトメトリクス設定をご希望ですか?
Which default metrics config do you want?
1. Basic
2. Standard
3. Advanced
4. None
default choice: [1]:
1上記の設定でよろしいですか?
Which default metrics config do you want?
1. Basic
2. Standard
3. Advanced
4. None
default choice: [1]:

Current config as follows:
{
        "agent": {
                "metrics_collection_interval": 60,
                "run_as_user": "root"
        },
        "metrics": {
                "aggregation_dimensions": [
                        [
                                "InstanceId"
                        ]
                ],
                "append_dimensions": {
                        "AutoScalingGroupName": "${aws:AutoScalingGroupName}",
                        "ImageId": "${aws:ImageId}",
                        "InstanceId": "${aws:InstanceId}",
                        "InstanceType": "${aws:InstanceType}"
                },
                "metrics_collected": {
                        "collectd": {
                                "metrics_aggregation_interval": 60
                        },
                        "disk": {
                                "measurement": [
                                        "used_percent"
                                ],
                                "metrics_collection_interval": 60,
                                "resources": [
                                        "*"
                                ]
                        },
                        "mem": {
                                "measurement": [
                                        "mem_used_percent"
                                ],
                                "metrics_collection_interval": 60
                        },
                        "statsd": {
                                "metrics_aggregation_interval": 60,
                                "metrics_collection_interval": 10,
                                "service_address": ":8125"
                        }
                }
        }
}
Are you satisfied with the above config? Note: it can be manually customized after the wizard completes to add additional items.
1. yes
2. no
default choice: [1]:
1
移行用にインポートする既存のCloudWatch Log Agentの設定ファイルはありますか?
Do you have any existing CloudWatch Log Agent (http://docs.aws.amazon.com/AmazonCloudWatch/latest/logs/AgentReference.html) configuration file to import for migration?
1. yes
2. no
default choice: [2]:
2
何らかのログファイルを監視しますか?
Do you want to monitor any log files?
1. yes
2. no
default choice: [1]:
2
SSMパラメータストアにconfigを保存しますか?
Saved config file to /opt/aws/amazon-cloudwatch-agent/bin/config.json successfully.
Current config as follows:
{
        "agent": {
                "metrics_collection_interval": 60,
                "run_as_user": "root"
        },
        "metrics": {
                "aggregation_dimensions": [
                        [
                                "InstanceId"
                        ]
                ],
                "append_dimensions": {
                        "AutoScalingGroupName": "${aws:AutoScalingGroupName}",
                        "ImageId": "${aws:ImageId}",
                        "InstanceId": "${aws:InstanceId}",
                        "InstanceType": "${aws:InstanceType}"
                },
                "metrics_collected": {
                        "collectd": {
                                "metrics_aggregation_interval": 60
                        },
                        "disk": {
                                "measurement": [
                                        "used_percent"
                                ],
                                "metrics_collection_interval": 60,
                                "resources": [
                                        "*"
                                ]
                        },
                        "mem": {
                                "measurement": [
                                        "mem_used_percent"
                                ],
                                "metrics_collection_interval": 60
                        },
                        "statsd": {
                                "metrics_aggregation_interval": 60,
                                "metrics_collection_interval": 10,
                                "service_address": ":8125"
                        }
                }
        }
}
Please check the above content of the config.
The config file is also located at /opt/aws/amazon-cloudwatch-agent/bin/config.json.
Edit it manually if needed.
Do you want to store the config in the SSM parameter store?
1. yes
2. no
default choice: [1]:
1
SSMパコンフィグの保存に使用するパラメータストア名を教えてください。
What parameter store name do you want to use to store your config? (Use 'AmazonCloudWatch-' prefix if you use our managed AWS policy)
default choice: [AmazonCloudWatch-linux]
AmazonCloudWatch-linux
コンフィグをどのリージョンのパラメータストアに保存しますか?
Trying to fetch the default region based on ec2 metadata...
Which region do you want to store the config in the parameter store?
default choice: [ap-northeast-1]
ap-northeast-1
パラメータストアにjson configを送信するのにどのAWSクレデンシャルを使用しますか?
Which AWS credential should be used to send json config to parameter store?
1. 88P55KSEAB5STMK9L44M(From SDK)
2. Other
default choice: [1]:
1
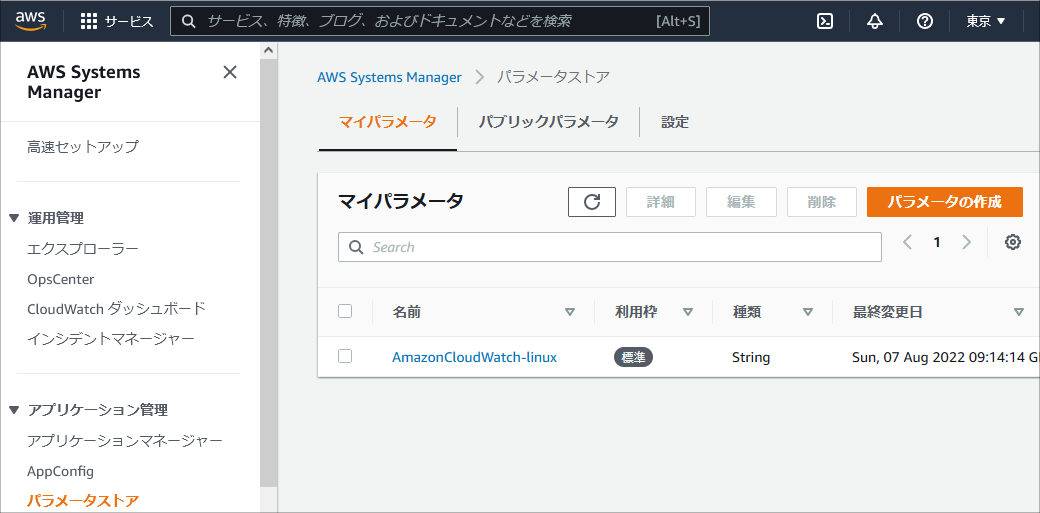
Successfully put config to parameter store AmazonCloudWatch-linux.
Program exits now.これでパラメータストアにConfigファイルが保存できました。
Collectdのインストール
CloudWatchエージェントに必要なCollectdパッケージをインストールします。
[ec2-user@ip-10-0-1-74 ~]$ sudo amazon-linux-extras install collectd
Installing collectd
Loaded plugins: extras_suggestions, langpacks, priorities, update-motd
Cleaning repos: amzn2-core amzn2extra-collectd amzn2extra-docker amzn2extra-kernel-5.10
17 metadata files removed
6 sqlite files removed
0 metadata files removed
Loaded plugins: extras_suggestions, langpacks, priorities, update-motd
amzn2-core                                                                                                                           | 3.7 kB  00:00:00
amzn2extra-collectd                                                                                                                  | 3.0 kB  00:00:00
amzn2extra-docker                                                                                                                    | 3.0 kB  00:00:00
amzn2extra-kernel-5.10                                                                                                               | 3.0 kB  00:00:00
(1/9): amzn2-core/2/x86_64/group_gz                                                                                                  | 2.5 kB  00:00:00
(2/9): amzn2-core/2/x86_64/updateinfo                                                                                                | 492 kB  00:00:00
(3/9): amzn2extra-docker/2/x86_64/primary_db                                                                                         |  89 kB  00:00:00
(4/9): amzn2extra-kernel-5.10/2/x86_64/updateinfo                                                                                    |  17 kB  00:00:00
(5/9): amzn2extra-collectd/2/x86_64/updateinfo                                                                                       |   76 B  00:00:00
(6/9): amzn2extra-docker/2/x86_64/updateinfo                                                                                         | 6.4 kB  00:00:00
(7/9): amzn2extra-collectd/2/x86_64/primary_db                                                                                       |  60 kB  00:00:00
(8/9): amzn2extra-kernel-5.10/2/x86_64/primary_db                                                                                    |  11 MB  00:00:00
(9/9): amzn2-core/2/x86_64/primary_db                                                                                                |  64 MB  00:00:02
Resolving Dependencies
--> Running transaction check
---> Package collectd.x86_64 0:5.8.1-1.amzn2.0.2 will be installed
--> Finished Dependency Resolution

Dependencies Resolved

============================================================================================================================================================
 Package                         Arch                          Version                                     Repository                                  Size
============================================================================================================================================================
Installing:
 collectd                        x86_64                        5.8.1-1.amzn2.0.2                           amzn2extra-collectd                        706 k

Transaction Summary
============================================================================================================================================================
Install  1 Package

Total download size: 706 k
Installed size: 2.0 M
Is this ok [y/d/N]: y
Downloading packages:
collectd-5.8.1-1.amzn2.0.2.x86_64.rpm                                                                                                | 706 kB  00:00:00
Running transaction check
Running transaction test
Transaction test succeeded
Running transaction
Warning: RPMDB altered outside of yum.
  Installing : collectd-5.8.1-1.amzn2.0.2.x86_64                                                                                                        1/1
  Verifying  : collectd-5.8.1-1.amzn2.0.2.x86_64                                                                                                        1/1

Installed:
  collectd.x86_64 0:5.8.1-1.amzn2.0.2

Complete!
  0  ansible2                 available    \
        [ =2.4.2  =2.4.6  =2.8  =stable ]
  2  httpd_modules            available    [ =1.0  =stable ]
  3  memcached1.5             available    \
        [ =1.5.1  =1.5.16  =1.5.17 ]
  5  postgresql9.6            available    \
        [ =9.6.6  =9.6.8  =stable ]
  6  postgresql10             available    [ =10  =stable ]
  9  R3.4                     available    [ =3.4.3  =stable ]
 10  rust1                    available    \
        [ =1.22.1  =1.26.0  =1.26.1  =1.27.2  =1.31.0  =1.38.0
          =stable ]
 11  vim                      available    [ =8.0  =stable ]
 18  libreoffice              available    \
        [ =5.0.6.2_15  =5.3.6.1  =stable ]
 19  gimp                     available    [ =2.8.22 ]
 20  docker=latest            enabled      \
        [ =17.12.1  =18.03.1  =18.06.1  =18.09.9  =stable ]
 21  mate-desktop1.x          available    \
        [ =1.19.0  =1.20.0  =stable ]
 22  GraphicsMagick1.3        available    \
        [ =1.3.29  =1.3.32  =1.3.34  =stable ]
 23  tomcat8.5                available    \
        [ =8.5.31  =8.5.32  =8.5.38  =8.5.40  =8.5.42  =8.5.50
          =stable ]
 24  epel                     available    [ =7.11  =stable ]
 25  testing                  available    [ =1.0  =stable ]
 26  ecs                      available    [ =stable ]
 27  corretto8                available    \
        [ =1.8.0_192  =1.8.0_202  =1.8.0_212  =1.8.0_222  =1.8.0_232
          =1.8.0_242  =stable ]
 28  firecracker              available    [ =0.11  =stable ]
 29  golang1.11               available    \
        [ =1.11.3  =1.11.11  =1.11.13  =stable ]
 30  squid4                   available    [ =4  =stable ]
 32  lustre2.10               available    \
        [ =2.10.5  =2.10.8  =stable ]
 33  java-openjdk11           available    [ =11  =stable ]
 34  lynis                    available    [ =stable ]
 35 †kernel-ng                available    [ =stable ]
 36  BCC                      available    [ =0.x  =stable ]
 37  mono                     available    [ =5.x  =stable ]
 38  nginx1                   available    [ =stable ]
 39  ruby2.6                  available    [ =2.6  =stable ]
 40  mock                     available    [ =stable ]
 41  postgresql11             available    [ =11  =stable ]
 42  php7.4                   available    [ =stable ]
 43  livepatch                available    [ =stable ]
 44  python3.8                available    [ =stable ]
 45  haproxy2                 available    [ =stable ]
 46  collectd=latest          enabled      [ =stable ]
 47  aws-nitro-enclaves-cli   available    [ =stable ]
 48  R4                       available    [ =stable ]
  _  kernel-5.4               available    [ =stable ]
 50  selinux-ng               available    [ =stable ]
 51  php8.0                   available    [ =stable ]
 52  tomcat9                  available    [ =stable ]
 53  unbound1.13              available    [ =stable ]
 54  mariadb10.5              available    [ =stable ]
 55  kernel-5.10=latest       enabled      [ =stable ]
 56  redis6                   available    [ =stable ]
 57  ruby3.0                  available    [ =stable ]
 58  postgresql12             available    [ =stable ]
 59  postgresql13             available    [ =stable ]
 60  mock2                    available    [ =stable ]
 61  dnsmasq2.85              available    [ =stable ]
 62  kernel-5.15              available    [ =stable ]
 63  postgresql14             available    [ =stable ]
 64  firefox                  available    [ =stable ]
† Note on end-of-support. Use 'info' subcommand.
[ec2-user@ip-10-0-1-74 ~]$EC2インスタンスのIAMロール変更
EC2サービスにアクセスします。
左ペインから「インスタンス」をクリックします。対象のインスタンスにチェックを入れます。
アクションボタンから[セキュリティ]-[IAMロールを変更]をクリックします。
IAMロールは「CloudWatchAgentServerRole」を選択します。
「IAMロールの更新」ボタンをクリックします。
CloudWatchエージェントの起動
Systems Managerサービスにアクセスします。
左ペインから「Run Command」をクリックします。「Run Command」ボタンをクリックします。
コマンドの実行画面は以下の通り設定します。
コマンドドキュメント:「AmazonCloudWatch-ManageAgent」にチェックを入れる。
コマンドのパラメータ
Action:configure
Mode:ec2
Optional Configuration Source:ssm
Optional Configuration Location:AmazonCloudWatch-linux(パラメータストア名)
Optional Open Telemetry Collector Configuration Source:ssm
Optional Restart:yes
ターゲット
インスタンスを手動で選択するにチェックを入れる。
インスタンス:対象のインスタンスにチェックを入れる。
「実行」ボタンをクリックします。
ステータスが「成功」していたらインストール完了です。
CloudWatchエージェントが起動していることを確認します。
[ec2-user@ip-10-0-1-78 ~]$ systemctl status amazon-cloudwatch-agent
● amazon-cloudwatch-agent.service - Amazon CloudWatch Agent
   Loaded: loaded (/etc/systemd/system/amazon-cloudwatch-agent.service; enabled; vendor preset: disabled)
   Active: active (running) since Wed 2022-08-31 18:40:41 UTC; 8min ago
 Main PID: 3326 (amazon-cloudwat)
   CGroup: /system.slice/amazon-cloudwatch-agent.service
           mq3326 /opt/aws/amazon-cloudwatch-agent/bin/amazon-cloudwatch-agent -config /opt/aws/amazon-cloudwatch-agent/etc/amazon-cloudwatch-agent.toml -...

Aug 31 18:40:41 ip-10-0-1-78.ap-northeast-1.compute.internal systemd[1]: Stopped Amazon CloudWatch Agent.
Aug 31 18:40:41 ip-10-0-1-78.ap-northeast-1.compute.internal systemd[1]: Started Amazon CloudWatch Agent.
Aug 31 18:40:41 ip-10-0-1-78.ap-northeast-1.compute.internal start-amazon-cloudwatch-agent[3326]: /opt/aws/amazon-cloudwatch-agent/etc/amazon-cloudwatc...it.
Aug 31 18:40:41 ip-10-0-1-78.ap-northeast-1.compute.internal start-amazon-cloudwatch-agent[3326]: I! Detecting run_as_user...
Hint: Some lines were ellipsized, use -l to show in full.
[ec2-user@ip-10-0-1-78 ~]$
CloudWatchメトリクスの確認
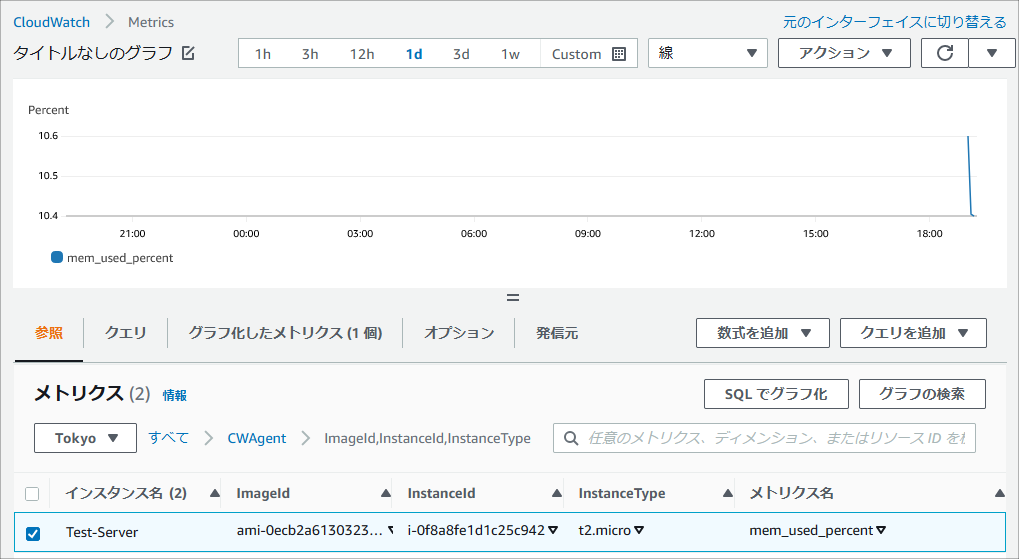
CloudWatchサービスにアクセスします。
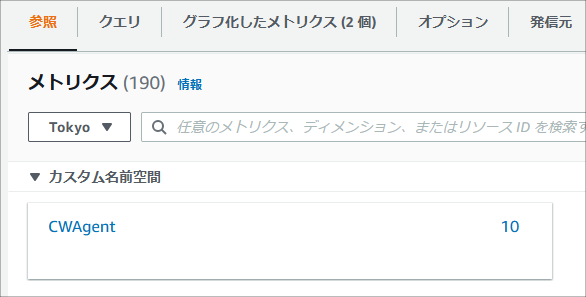
左ペインから「すべてのメトリクス」をクリックします。
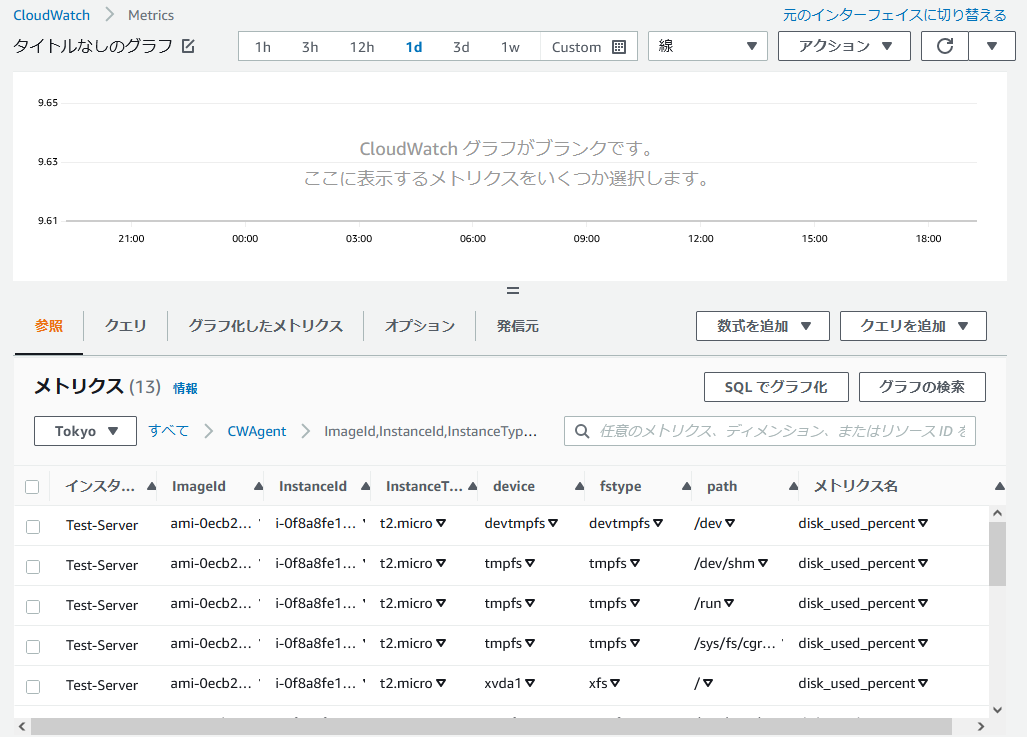
「CWAgent」が表示されるようになっています。
「CWAgent」配下を見ていくとディスクの使用率やメモリ使用率を確認することができます。


コメント